Word2Vector
20 Oct 2018

Word2Vec
In the past, “one hot encoding” was the orthodox method in Natural Langauge Processing when transforming text data into processable numeric data. The one-hot encoding method represents categorical data into numerical data by generating standard unit vectors. $N$ words will generate corresponding $n$ n-dimensional standard unit vectors.
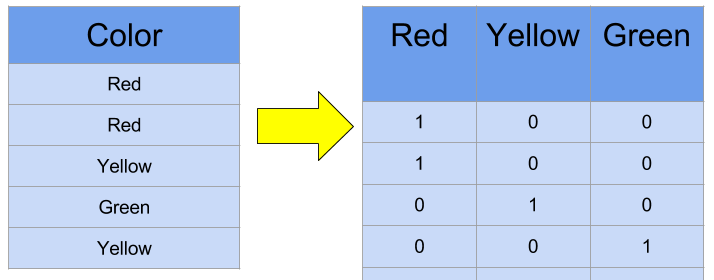 However, this type of encoding cannot reflect semantic and relational meaning between respective words. In other words, It cannot represent or imply the similarity of words. Moreover, increase in the number of words will expand the dimension which will eventually lead to complex computation, because one hot encoding only uses the axis of n-dimension.
To overcome these limitations, there has been numerous approaches to apply semantical meaning and reduce dimension. Some of the methods include: NNLM, RNNLM, CBOW, Skip-gram.
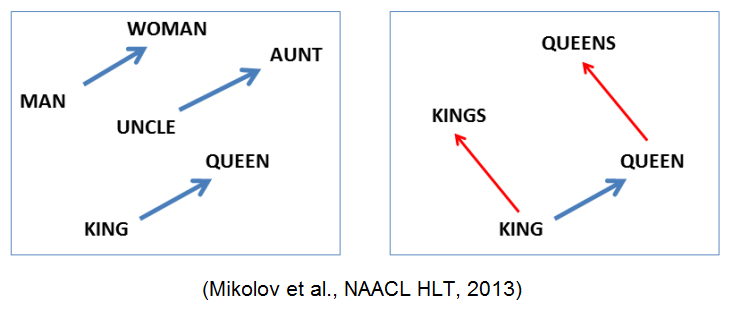 One hot coding is a Sparse Representation, which indicates that majority of elements are 0 in matrix or vector. As an alternative way, Distributed Representation or Dense Representation was used to embed semantic of words to vector. This process is called “embedding”. Words represented by these methods and went through embedding process is called embedding vector.
As word2vec adopts distributed representation, it assumes the distributional hypothesis. The assumption is that “words with similar position have similar meanings”. Word2Vec suggests two network models to train data. One is CBOW( continuous bag of words) model and the other is Skip-gram model.
CBOW Model (Continiuous Bag of Words) & Skip-gram Model
CBOW uses surrounding words(context words) to predict the words in the middle (center words), while Skip-gram model uses center words to predict surrounding words. Simply saying, CBOW is answering to a question of “given a set of these context words, what missing word (center word) is likely to appear at the same time?”. Skip-gram is answering to a question of “given this one word, what are the other words that are likely to appear at the same time?”. Both methods are supervised learning, training the Word2Vec model with corpus data.

references
- https://wikidocs.net/22660 (NLP introduction using Deep Learning)
- https://shuuki4.wordpress.com/2016/01/27/word2vec-%EA%B4%80%EB%A0%A8-%EC%9D%B4%EB%A1%A0-%EC%A0%95%EB%A6%AC/
Support Vector Machine
14 Oct 2018

Support Vector Machine (SVM)
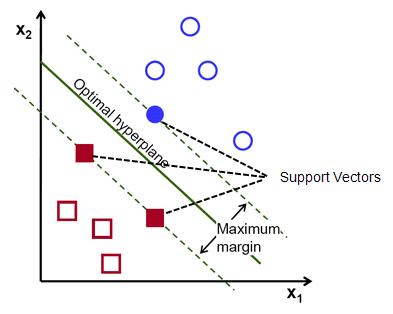
Support Vector Machine (a.k.a SVM) is one of the famous machine learning techniques. It is mainly used for supervised machine learning(classification) and regression analysis. It uses the concept of hyperplane for optimal classification.
- Suited for extreme cases ( Segregates two classes with a vector gap)
- Only support vectors are important, whereas other training examples are relatively unimportant
- Use support vectors to find hyperplane that maximize the margin between classified groups
- Depending on the circumstances, it can be linear or non-linear
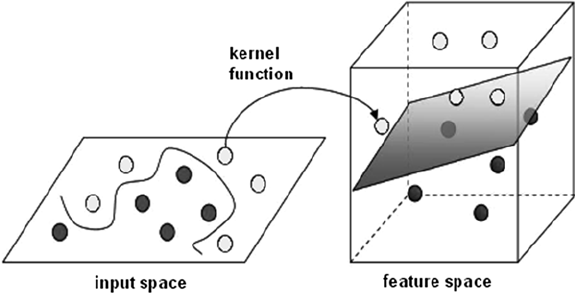
- Kernel function can be used to transform non-linear into higher dimensional feature space to make linear separation possible. This is called kernel trick (see image below)
Agenda Setting
13 Oct 2018

Agenda Setting
Agenda setting is a theory that suggests that mass media (newspaper, broadcasts, televisions) are influencing the public of “what to think about”. Simply saying, if a news item is frequently addressed, the public will perceive it more significant and important.
“The press may not be successful much of the time in telling people what to think, but it is stunningly successful in telling its readers what to think about” - McCombs and Shaw (1972)
There is a scene in a famous movie Inception (2010) by Christopher Nolan that is quite relevant to agenda setting:
Saito: “If you can steal an idea from someone’s mind, why can’t you plant one there instead?”
Arthur: “Okay. Here is me planting an idea in your head. I say to you, don’t think about elephants. What are you thinking about?”
Saito: “Elephants…?”
Arthur: “Right, but it is not your idea. The dreamer can always remember the genesis of the idea. True inspiration is impossible to fake.”
Forcing and shaping how people think is complicated. Belief, faith and perspective are formed by external variables such as different personal experience and environment and person’s innate nature. In fact, these are what we refer to as bias. Influencing and changing people "”what to think”“ is a difficult matter. However, “what to think about” is relatively easy. All you have to say is “think about elephants”. Regardless of people’s perspectives, background or personalities, for a while, people will have elephants in their mind.
Spearman Correlation
12 Oct 2018

Correlation
Correlation is a concept that is used to measure the association between variables, whether they are related or not. If the variables are related examining whether the relationship is positive or negative, or whether a specific model can explain the relationship. (Linear, non-linear)
For example, pearson correlation measure the “linearity” of two continuous variables, assuming that the two variables follow normal distribution.
Spearman Correlation ($\rho$)
-
Spearman’s Correlation measures the correlation between two variables, taking their rankings into account. It evaluates the variables in a non-parametric way; meaning that it uses statistical method where data is not required to follow a normal distribution. In other words, Spearman correlation does not assume anything about the distribution of data.
- The assumption required for Spearman correlation are that:
- the data must be at least ordinal
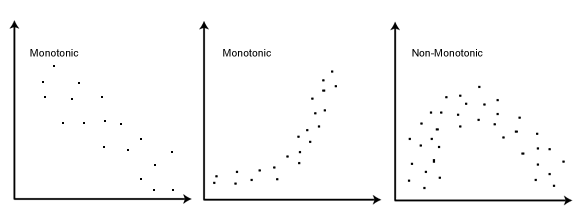
- the scores on one variable must be monotonically related to the other variable.
- The correlation is calcuated as a following equation: $\rho = 1 - \frac{6 \sum d_{i}^{2}}{n(n^{2}-1)}$
- $\rho$ : Spearman rank correlation
- $d_i$ : the difference between the ranks of corresponding variables
- $n$ : number of observations
Interpreting the value of Spearman Correlation
-
The Spearman correlation coefficient can take values from +1 to -1
\(( -1 < \rho < +1)\)
-
+1 indicates a perfect association of ranks, while -1 indicates a perfect negative association between ranks. The closer value to 0, implies the weaker association between the ranks.
Naive Bayes Classifier
11 Oct 2018

Naive Bayes Classifier
Naive Bayes is one of the machine learning techniques used for classification and prediction. Obviously, it involves Bayesian Theorem. The classifier assumes that all explanatory variables are independent to each other respectively contributing to the response variable.
Advantage
-
Naive Bayes classifier can be trained effectively on Supervised Learning Environment, because it does not require a lot of data for training.
-
Despite its simplicity and design, it has been proven to work well in various complex situations
Model
Naives Bayes Model is conditional probabilistic model. The \(n\) features (independent explanatory variables) are represented as vector \(\mathbf x = (x_1,x_2,x_3,x_4,....x_n)\), which is the data given for instance classification.
The instance probabilities are \(p(C_k \vert x_1,...,x_n)\). In other words, the probability is calculated for all \(K\) (or \(C_k\)) possible outcomes.
Instance Probability Model
\[p(C_k \vert \mathbf x) \biggl(= p(C_k \vert x_1,...,x_n)\biggr) = {p(C_k)*p(\mathbf x \vert C_k) \over p(\mathbf x)}\]
The denominator $p(\mathbf x)$ is always the same, so when comparing probability between instances and find the best classification, the numerator part is the one that only matters.
Using the characteristics of conditional probability and if the explanatory variables are independent, the numerator part above can be altered like this:
.
.
.
Altered Numerator
\[\begin{align}
p(C_k)*p(\mathbf x \vert C_k) \\
& = p(C_k)*p(x_1,...,x_n \vert C_k)\\
& = p(x_1,...,x_n,C_k)\\
& = p(x_1 \vert x_2,..,x_n,C_k)*p(x_2,...,x_n,C_k)\\
& = p(x_1 \vert x_2,..,x_n)*p(x_2 \vert x_3,...,
x_n)*p(x_3,...,x_n,C_k)\\
& = ...\\
& = p(x_1 \vert x_2,..,x_n,C_k)*p(x_2 \vert x_3,...,x_n,C_k)*p(x_3 \vert x_4,...,x_n,C_k)...*p(x_{n} \vert C_k)*p(C_k)\\
& = p(x_1 \vert C_k)*p(x_2 \vert C_k)*p(x_3 \vert C_k)...*p(x_{n-1} \vert C_k)*p(x_n \vert C_k)\\
\end{align}\]
Thus, the final model can be written as:
\[p(C_k \vert \mathbf x) \varpropto p(C_k)*\prod_{i=1}^{n} p(x_i \vert C_k)\]
In short, the Naive Bayes Classifier is product of all conditional probablities of explanatory variables to the given category and the probability of category itself.

 However, this type of encoding cannot reflect semantic and relational meaning between respective words. In other words, It cannot represent or imply the similarity of words. Moreover, increase in the number of words will expand the dimension which will eventually lead to complex computation, because one hot encoding only uses the axis of n-dimension.
To overcome these limitations, there has been numerous approaches to apply semantical meaning and reduce dimension. Some of the methods include: NNLM, RNNLM, CBOW, Skip-gram.
 One hot coding is a Sparse Representation, which indicates that majority of elements are 0 in matrix or vector. As an alternative way, Distributed Representation or Dense Representation was used to embed semantic of words to vector. This process is called “embedding”. Words represented by these methods and went through embedding process is called embedding vector.
As word2vec adopts distributed representation, it assumes the distributional hypothesis. The assumption is that “words with similar position have similar meanings”. Word2Vec suggests two network models to train data. One is CBOW( continuous bag of words) model and the other is Skip-gram model.


