Data Manipulation with Pandas 1
29 Jul 2019

Pandas
Pandas is a python data analysis toolkit that provides fast, flexible and expressive data structures designed to make working with “relational” or “labeled” data in easy and intuitive way. The name pandas came from the term “panel data”. Anyone interested in Data Analysis using python should better get familar with this library.
There are many posts, books and even official documentations that explains how to make use of this wonderful library. In this post, I would like to discuss practical techniques and summarize the gist of pandas.
DataFrame
Pandas has two types of data structure:
- Series : 1-Dimensional
- DataFrame: 2-Dimensional
For more basic tutorial about Pandas and numpy, please check my tutorial on the GitHub
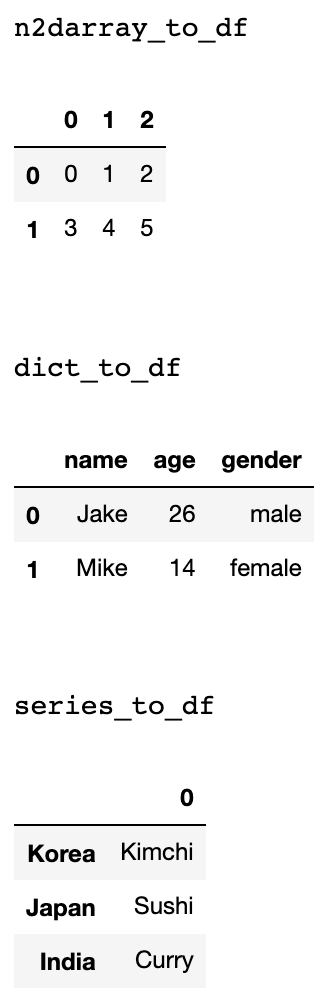
Dataframe is an expression of data into a tabular form. In pandas, three elements are used to create dataframe: column (variable name), row (data), and index. Dataframe can be created from different forms of python data types. List, dictionary, pandas series, and numpy ndarray can be used to make Dataframe. Example codes are presented below:
import pandas as pd
import numpy as np

# numpy 2d array to dataframe
nd_array = np.array([[0,1,2],[3,4,5]])
n2darray_to_df = pd.DataFrame(nd_array)

# dictionary to dataframe
my_dict = {"name": ["Jake","Mike"],"age":["26","14"],"gender":["male","female"]}
dict_to_df = pd.DataFrame(my_dict)

# pandas series to dataframe
my_series = pd.Series({"Korea":"Kimchi","Japan":"Sushi","India":"Curry"})
series_to_df = pd.DataFrame(my_series)
Accessing data in DataFrame
DataFrame is very similar to spreadsheets that you can see on Excel. Just as Microsoft Excel, you can access to specific parts of data by filtering and indexing your DataFrame. We will use this data for demonstration.
Reading Data
In order to open your csv (comma seperated version) file, all you need is one line of code after the import:
#importing pandas library
import pandas as pd

# Reading file
df = pd.read_csv("YOUR DIRECTORY/pd_tutorial.csv")

# Displaying a few lines on the top of the file
df.head()

# Shows the size of your data in a tuple
df.shape
Indexing, Filtering and Selection
In order to analyze data, one should be able to properly manipulate, select and retrieve their subject data. This means that proficiency in indexing, filtering and selection determines the efficiency of work. This is the main reason why I wrote and organized this post.
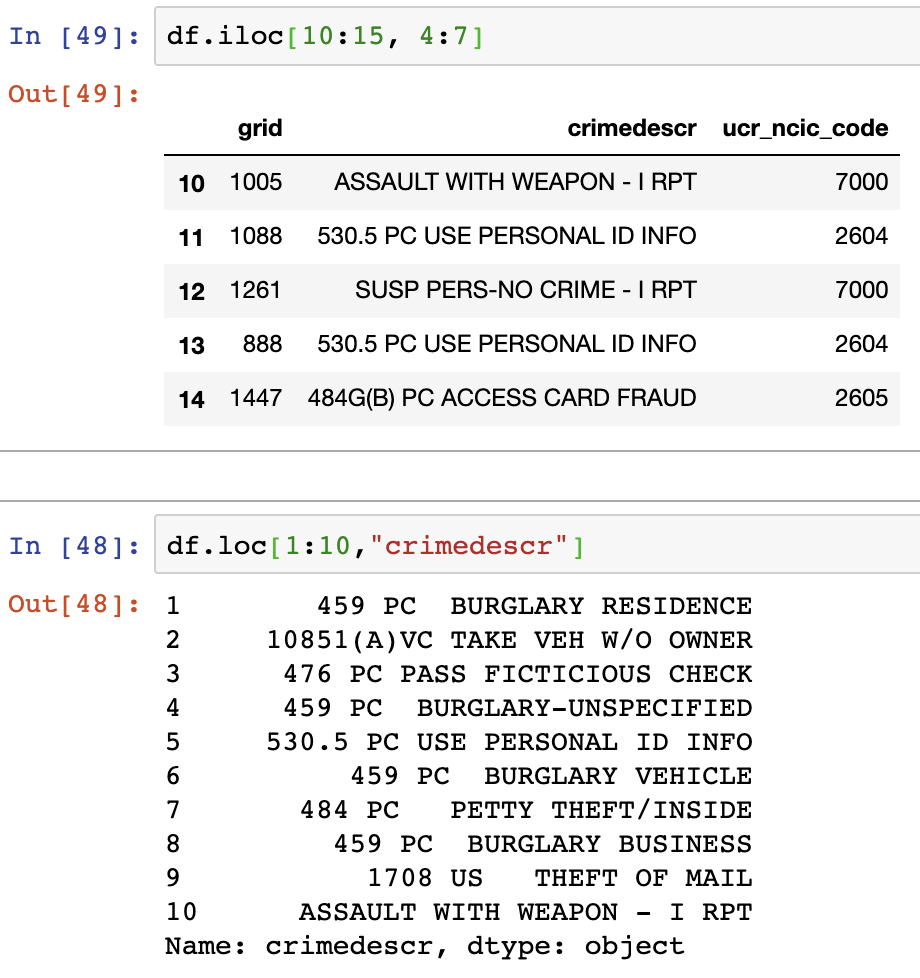
1. iloc, loc
These are the most basic functions used to find data from dataframe.
- iloc : uses integer position to find values. Labels and strings are not supported
- loc: uses label to find values.
2. Indexing
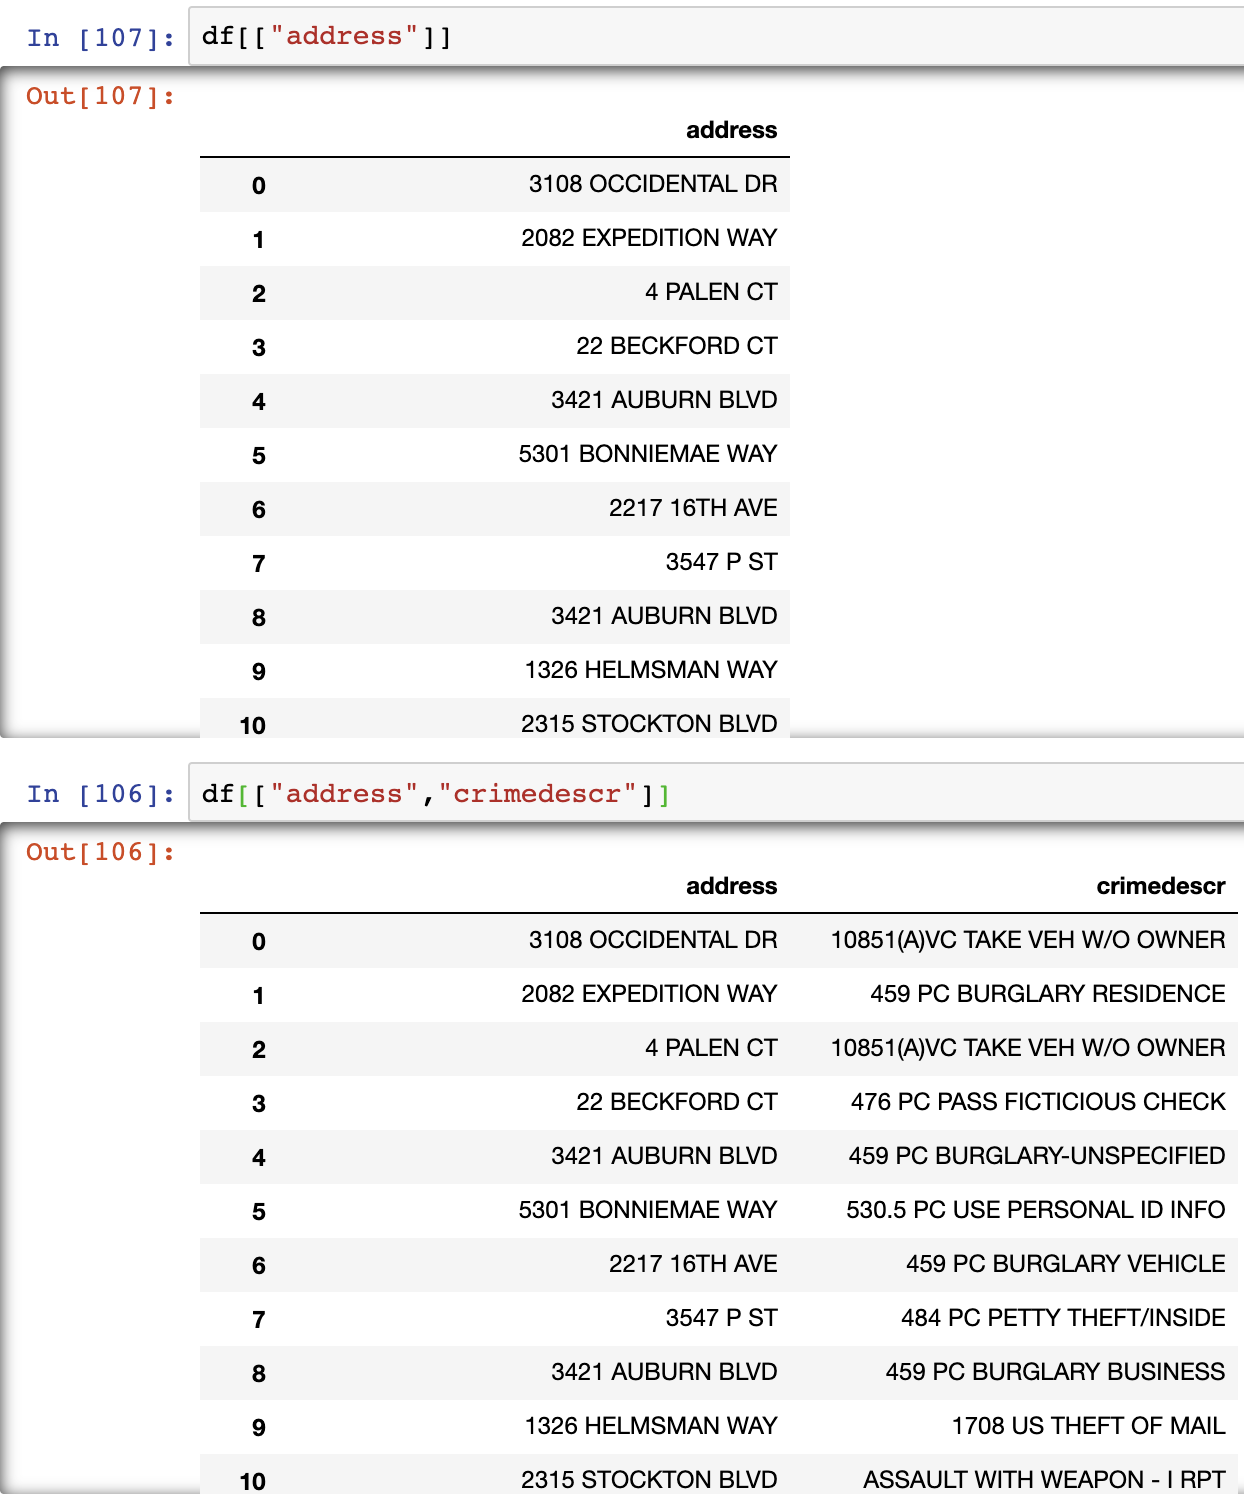
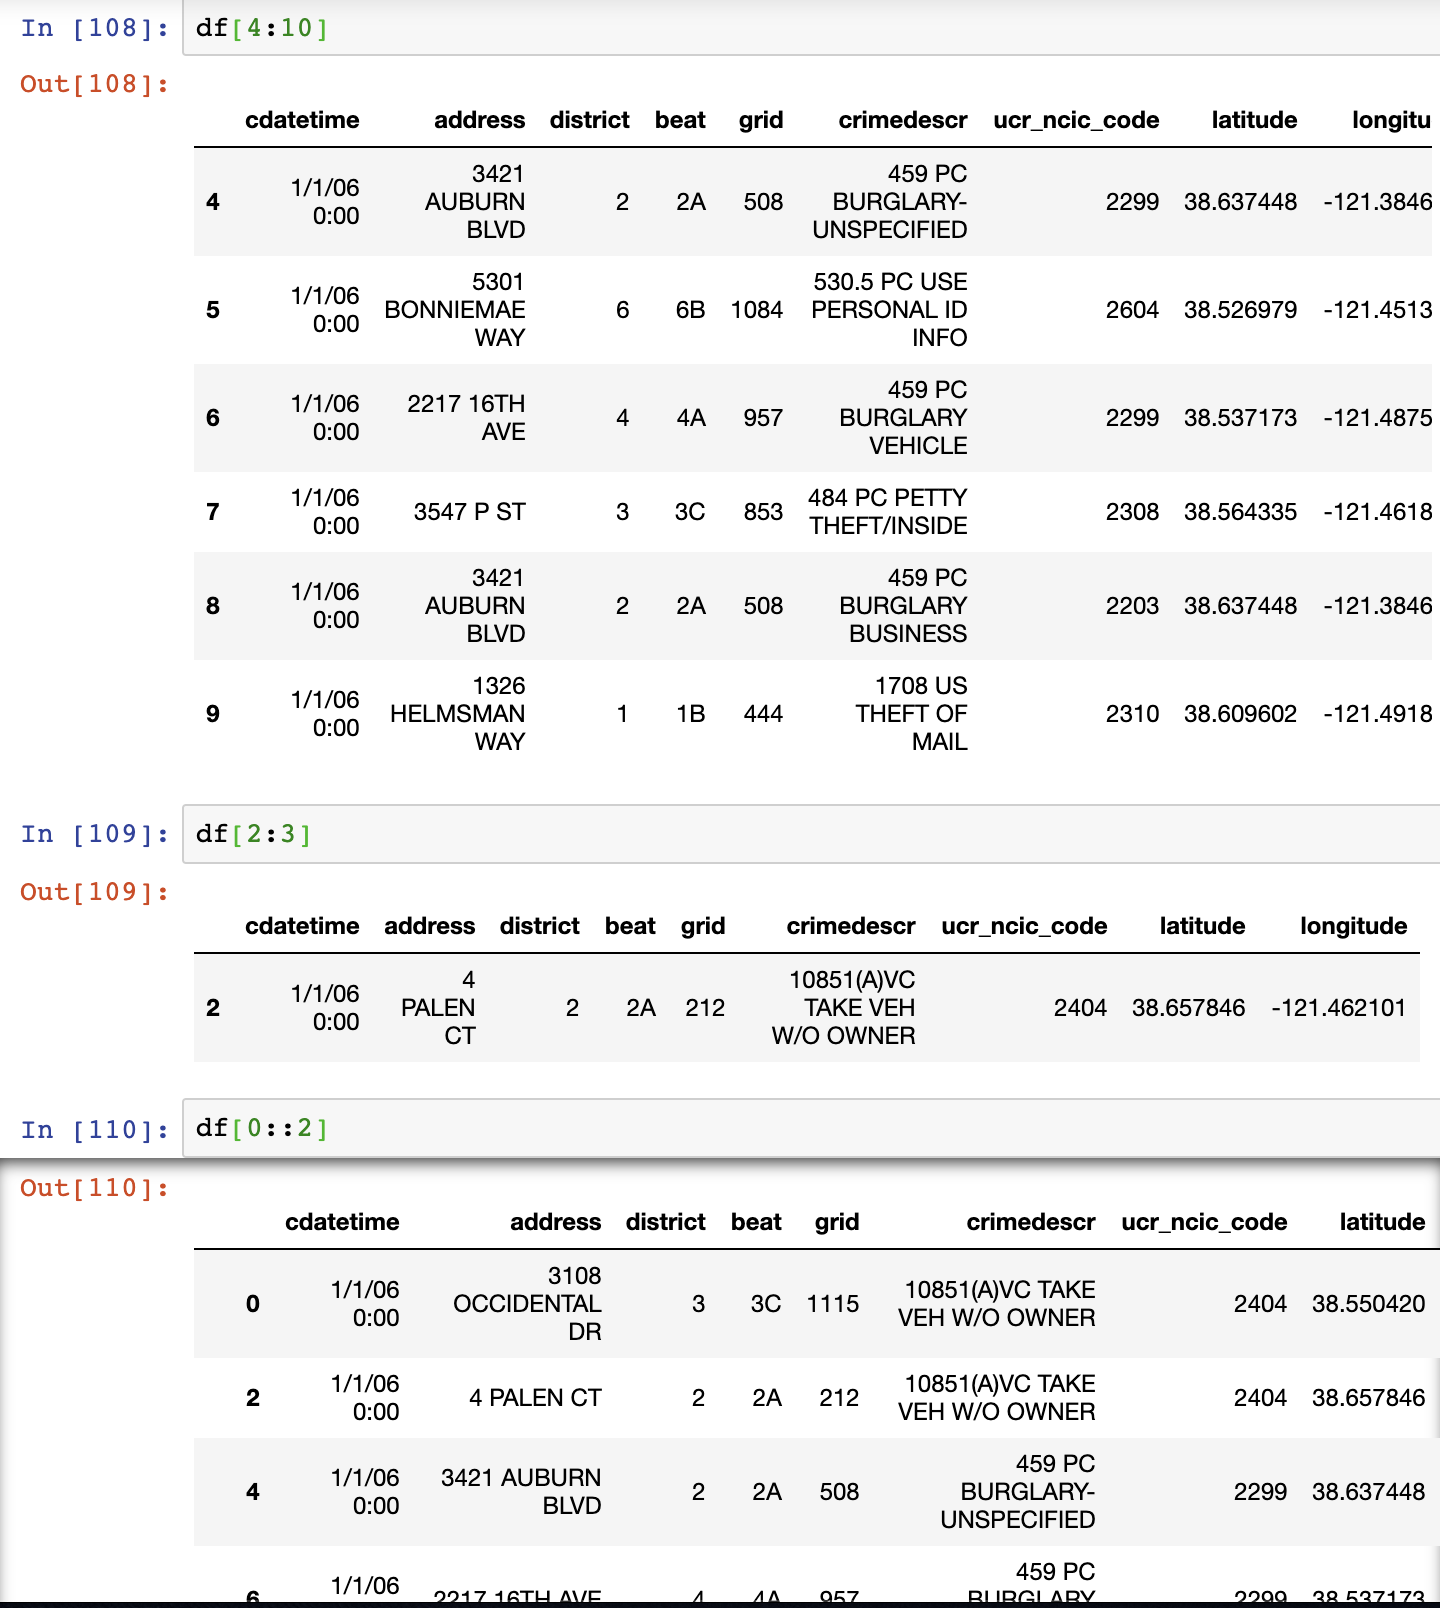
Similar to indexing with lists, Pandas dataframes can also be indexed in a similar way.
# Retrieving a specific column
df["COLUMN NAME"]  # Returns pandas.Series
df[["COLUMN NAME"]] # Returns pandas.DataFrame

# Retrieving multiple columns
df[["COLUMN 1", "COLUMN 2"]] # Returns pandas.DataFrame

# Retrieving specific rows
df[ num1 : num2 ] # Returns rows from index num1 to num2 - 1
3. Using Conditions
You can make use of conditions to filter data of your interest too. If the outcome of respective conditions produce boolean values, the filtering would turnout fine. The example below gets crime data which occurred in district 3 with "Traffic" included in the crime description. The function *.head()* is similar to SQL query *LIMIT*. It is used to retrieve the requested amount of lines of data. In the example, 10 lines are retrieved as a result.
# dataframe[ ( CONDITION1 )   OPERATOR  ( CONDITION2 ) ]

# OPERATOR
& # for and
| # for or
^ # for xor

# CONDITION Examples
# value 4 only from a column
dataframe["COLUMN NAME"] == 4

# values larger than 4 from a column
dataframe["COLUMN NAME"] > 4

# value that includes keyword "APPLE" from a column
dataframe["COLUMN NAME"].str.contains("APPLE")

# value without keyword "APPLE" from a column
~dataframe["COLUMN NAME"].str.contains("APPLE")
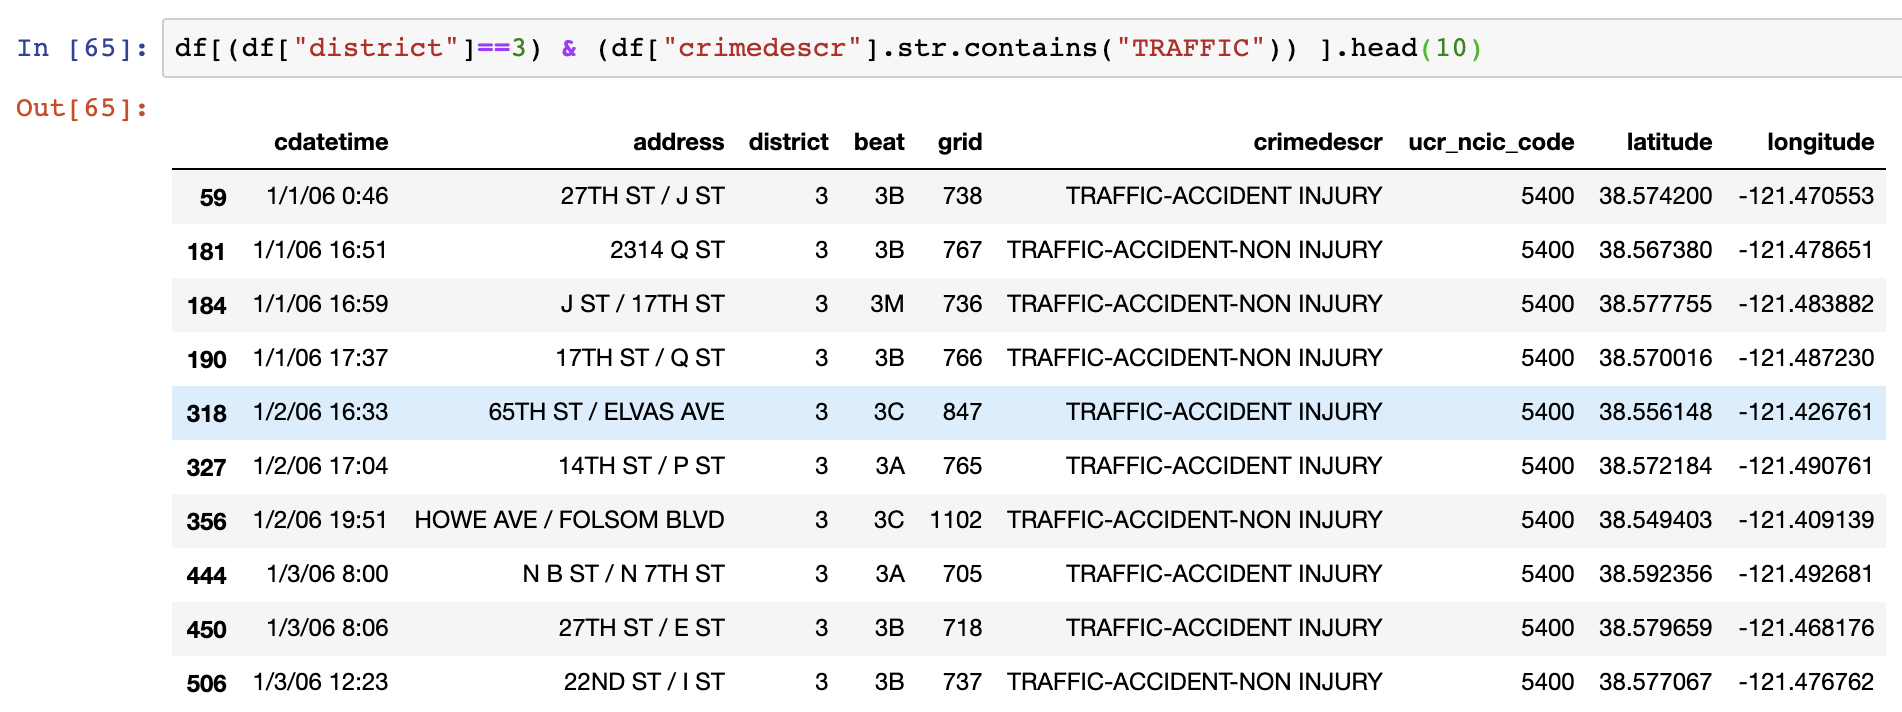
So, this was probably the basic manipulations that you can do with pandas. In the next post, I will cover the “fancy” tricks.
References
- https://towardsdatascience.com/10-python-pandas-tricks-to-make-data-analysis-more-enjoyable-cb8f55af8c30
- https://www.datacamp.com/community/tutorials/pandas-tutorial-dataframe-python
- https://www.shanelynn.ie/select-pandas-dataframe-rows-and-columns-using-iloc-loc-and-ix/
Linear Algebra Terminology
20 Jun 2019

Span, Linear Combination, Linear Independence
-
Linear combination is vectors expressed by scalar multiplication or addition of vectors.
-
Span (or Linear Span) of a set of vectors is the set of all linear combinations of those vectors.
-
A set of vectors are linearly independent, only if all vectors contribute to their span. In other words, removing one of the vectors from the set would affect the span.
Definitions of linear combination, span and linear independence have been given above. However, these definitions are not very intuitive or give us a clear picture of what they mean. Here, I will attempt to provide visual and geometrical implication of these definitions.
Linear Combination
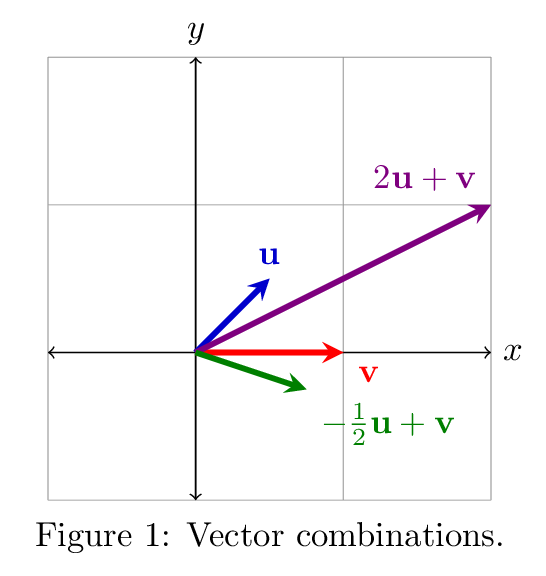
The illustration above shows two results of combination of $\vec{u}$ and $\vec{v}$.
Linear combination refers to addition of vectors that are multiplied by some numbers (or scalars). The purple and green vectors can be seen as a linear combination of $\vec{u}$ and $\vec{v}$.
In general, linear combination can be expressed as an expression below:
$a_1\vec{x_1}+a_2\vec{x_2} +a_3\vec{x_3}+a_4\vec{x_4}+… a_n\vec{x_n} $
Span

Span of vectors can be viewed as a collection of all linear combinations of those vectors. For example, the span of red and blue vector ($\vec{u}$ and $\vec{v}$) from the illustration above will a collection of the green vectors (linear combinations of $\vec{u}$ and $\vec{v}$), which will form the pink plane (the span of $\vec{u}$ and $\vec{v}$)
Linear Independence
Imagine a linear combination of two vectors that have same direction, but different in their scale. What would their span look like?
From the previous illustration, we can easily see that the span would look like a straight line. For example, the red line that vector $\vec{u}$ and $2\vec{u}$ spans, or the blue line that the blue vector $\vec{v}$ and $2\vec{v}$ spans. However, these lines can be spanned without $2\vec{u}$ or $2\vec{v}$. $\vec{u}$ and $\vec{v}$ are sufficient enough to span these lines. This is where the definition of linear independence kicks in.
We can say that a set of vectors are linearly independent, only when the respective vectors are not a linear combination of any pairs of remaining vectors.

On the right, $\vec{w}$ is a linear combination of $\vec{u}$ and $\vec{v}$, whereas on the left $\vec{w}$ cannot be represented by a linear combination of $\vec{u}$ and $\vec{v}$. So, the left is the case when we can say that $\vec{u},\ \vec{v}$ and $\vec{w}$ are linearly independent.
Reference
https://www.youtube.com/watch?v=k7RM-ot2NWY&list=PLZHQObOWTQDPD3MizzM2xVFitgF8hE_ab&index=2
Why Linear Algebra?
18 Jun 2019

Back in the 2016, I enrolled into a Linear Algebra course and struggled to complete it. It was a requisite course for graduation of university, so I did not have a choice. The course was terrible, despite the effort of professor. It was difficult, easy to skip morning class, and besides I took the course alone.
I did not acknowledge the importance of the Linear Algebra, as I did not have much thought about Data Science nor development at that time. I have to admit that my attitude was not engaged. Several years have passed from then and I regret the past. I felt that I need to study this course once more before proceeding to my master’s degree.
So, let’s not repeat the past and see why Linear Algebra is regarded as an important course.
Importance of Linear Algebra

Roughly speaking, Linear Algebra is a subject that studies vectors and matrices. Data tends to come in as a table or matrix, an array of numbers and we also process them as in columns or rows. So, it is quite natural to study Linear Algebra in order to interpret, understand or manipulate data.
The subject, in fact, deals with the most fundamental and the simplest form of mathematical problems, which is the sum of constant times variables just like a set of equations below:
\(ax_1+bx_2+cx_3 = p \\
dx_1+ex_2+fx_3 = q \\
gx_1+hx_2+ix_3 = r\)
In order to understand space, dimension, vectors, Linear Algebra is the basic where you should start.
InfoGAN
06 Apr 2019

Information Maximizing Generative Adversarial Network (InfoGAN) attempts to learn disentangled representations by maximizing mutual information cost. It introduces a simple add-on on GAN to fulfill its purpose. The key idea is to insert a latent code that represents specific feature in a Generative Model and maximize the mutual information between the code and the generated distribution.
…. Let’s try to understand these sentences above. First, let’s look at the context behind this GAN.
The Context Behind InfoGAN
Information in general terms is defined as facts about a situation, person, events, etc. It plays a crucial role in making decisions, solving various problems and adapt to changes. As much as it is important, devising a way to measure and quantify information is also neccessary. So, how can we measure information?
This is done by a field of science called information theory, which aims to study the quantification, storage and communication of information. Information theory was proposed by Claude Shannon in his seminal paper “A Mathematical Theory of Communication”, where he introduced the concept information entropy: a method to measure information.
Information Content, Information Entropy, Mutual Information
Information content (=surprisal) is defined as the amount of information gained when it is sampled. The core idea behind this is that unlikely event (events with less probability) has more amount of information than the more likely event (events with higher probability). Because information that everyone knows is not highly valuable, high probability of event would carry less information then an event with low probability. In this sense, information content is defined as:
 $Information\ content: I(x) = -logP(x) $
Meanwhile, the keyword of information theory is “entropy”. Entropy measures the uncertainty of situation in physics. The definition of information entropy is “the expectation at which information is produced by a stochastic source of data”. Thus, in relevance to the mathematical statistics, expectation of information content would be the information entropy, or Shannon entropy:
\(H(x) = - \sum_{i} P_{i}logP_{i}\)
Mutual Information quantifies the amount of information learned from knowledge of one random variable about the other random variable. If the two random variables are independent, information of a random variable cannot be obtained by knowing the other random variable. For example, knowing that a flipped coin was a tail, does not give any information about whether it would rain tommorow or not. In this context, mutual information of X, Y would be 0 if the two variables are independent. The mutual information of can be expressed using the difference of Shannon entropy in conditional aspect:
\[Mutual \ Information: I (X;Y) = H(X) - H(X|Y) = H(Y) - H(Y|X)\]
Disentangled Representation
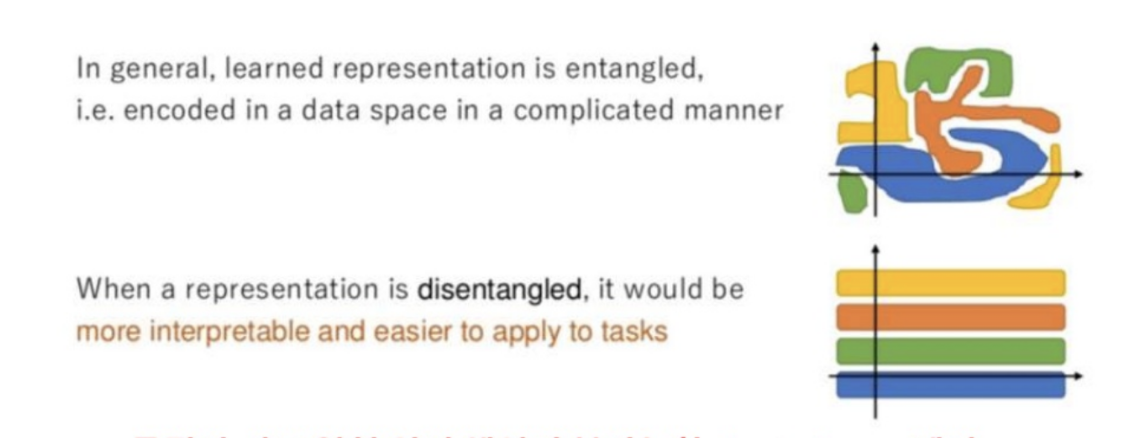
Disentangled representation refers to the idea of disentangling a highly entangled data; most data includes representation of features, but they are entangled in a complicated manner, thus it is hard to identify these features on a seperate term.
For example, let’s say that there is an image of cat. The image of cat itself is highly entangled data of various representative features such as whiskers, triangular ears, tails, nose, etc. If unsupervised machine can learn these representations seperately, it would be able to produce better results.
The figure below is an excellent example of disentagled representation:
source: https://www.slideshare.net/ssuser06e0c5/infogan-interpretable-representation-learning-by-information-maximizing-generative-adversarial-nets-72268213
InfoGAN
So far, we have skimmed through the background knowledge involving Information Maximization GAN. Finally we can talk about how InfoGAN works.
What is GAN?
05 Apr 2019

Introduction
Since April 1st, I started working with a startup company named Crevasse A.I, which aims to develop a customized A.I generator of copy-right free images. As the company tries to utilize GAN technology, I had to understand and develop modules based on these deep learning theories.
As I would like to keep track of my studies and works involving A.I, I will be posting summaries of research papers and github repositories that I worked on.
But first, let’s start with GAN, which became the most standardized methodology of unsupervised learning.
Supervised vs Unsupervised Machine Learning
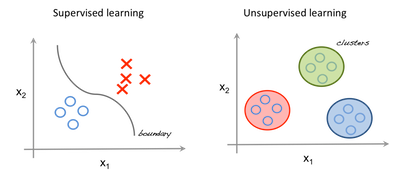
The ultimate objective of machine learning (deep learning is a subset of machine learning) is to predict future with given data. The difference between unsupervised and supervised machine learning depends on the existence of labels (Let’s set aside Reinforment Learning in this post).
Since supervised machine learning requires labeled dataset or data with answers, the amount of usuable data is strictly limited as it takes resources to create large amount of labeled data.
source: towardsdatascience.com
On the other hand, unsupervised learning trains without labels, allowing machines to find answers by themselves. In this sense, many scholars and A.I experts regard unsupervised machine learning as the leading technology for the next-generation. And the most representative and widely studied unsupervised model is Generative Adververisal Network (GAN)
GAN
As it name implies, GAN is composed of two models: Generative Model($G$) and Discriminitive Model ($D$). While Generative Model generates a new data, Discriminitive Model discriminates the generated data whether it is fake or real. The two model competes (adverses), until a certain point where Discriminitive Model cannot distinguish fake data from real data.

Generative Adversarial Network (GAN)
source: https://www.researchgate.net/figure/Generative-Adversarial-Network-GAN_fig1_317061929
In order to understand GAN fully, knowledge on probability distribution is a requisite. GAN treats all data as a random variable with a certain probability distribution. The Generative Model ($G$) tries to approximate to the real probability distribution of data. if this is accomplished, it will produce real-like-fake data based on the approximated real probability distribution, and the Discriminitive Model ($D$) would not be able to distinguish the fake from the real by throwing a meaningless probability: 50%

GAN over its training
black dotted line: real data probability distribution
green dotted line: probability distribution made by G
blue dotted line: probability distribution of D
source: IAN GOODFELLOW GAN paper
GAN in Mathematical Context

Mathematical Expression of GAN


 $Information\ content: I(x) = -logP(x) $


