Data Manipulation with Pandas 2
04 Aug 2019
Pandas Tricks
In the previous post, basic usage of pandas was explained. In this post, more technical and useful tricks will be introduced. The following list of contents will be covered:
- Transpose
- Correlation
- Column Manipulation (re-ordering, re-naming, etc.)
There are many posts, books and even official documentations that explains how to make use of this wonderful library. In this post, I would like to discuss practical techniques and summarize the gist of pandas.
Transpose
Let’s say you have data that looks like this:

Sometimes, you may want to switch rows and columns. This is when transpose function is used.
import pandas as pd

# Generate DataFrame
df = pd.DataFrame({"Student ID": [34933,93759,20847,65947,24956,65692,24271],
                  "First Name":["Victoria","Justin","Jessica","Michelle","David","Franklin","Alissa"],
                  "Last Name":["Slater","McNeil","Bennett","Dolin","Price","Mullins","Lee"],
                  "Credits completed":[36,82,56,112,57,13,77],
                  "GPA":[3.27,3.54,2.87,3.81,2.34,3.72,2.96]
                  })

# Transpose
df_t = df.transpose() # or  df.T  also works
You can see the result of the transpose as shown in the image below.
![]()
Calculating Correlation
In EDA(Exploratory Data Analysis), correlations between variables are essential statistical measures to gain insights from data. Pandas makes this calculation easy for us, with just a simple line of code.
import pandas as pd
# Generate example dataframe
df = pd.DataFrame({"Average Time Spent in Library per day":[1,2,3,4,5,6,7,8,9],
"GPA":[2.8,3.2,3.0,3.5,3.4,3.8,3.7,3.8,4.0]})
# Calculate correlation between the two columns
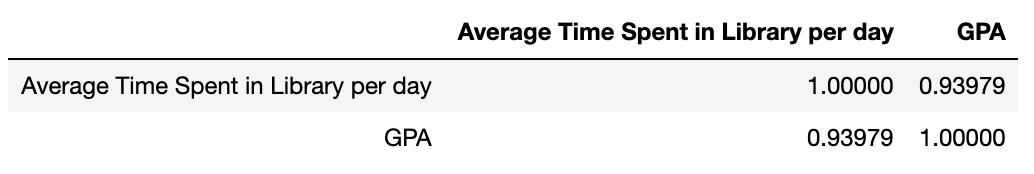
df.corr()
The .corr() function returns the result in a matrix form. The diagonal values of the matrix can be ignored as correlation of variable with itself is always 1. In this example, the correlation between the time you spend on library is highly correlated to your GPA or vice versa.
Remember that correlation does not guarantee any causal relationship. So use it wisely.
Column Manipulation, Operation
Just like Microsoft Excel, Pandas allows its users to generate new columns from existing columns (only If the columns have operatable data types)
import pandas as pd
# Generate example dataframes
df = pd.DataFrame({"Name":["A","B","C","D"],
"Income":[320000,240,380,23000],
"Currency":["KRW","EUR","CAD","JPY"]})
rate = pd.DataFrame({"Rate":[0.76,0.00084,0.0094,1.11],
"Currency":["CAD","KRW","JPY","EUR"]})
# Merge currency dataframe into df
df = df.merge(rate, how="left", on="Currency")
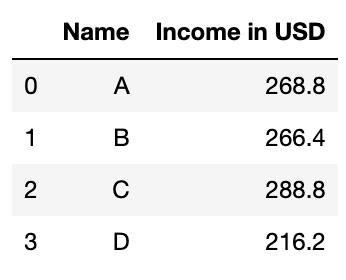
# Calculate income in USD using two columns Rate and Income
df["Income in USD"] = df["Income"]*df["Rate"]
# Let's see who earns the most
df[["Name","Income in USD"]]
So, we can see that person C earns the most.