
Confusion Matrix
08 Jan 2019
Among the ways of measuring the performance of prediction by n machine learning or statistical analysis, there is Confusion Matrix(or Error Matrix).
The Confusion Matrix is a type of contingency table(or Pivot Table), where data are presented in cross tabulated format. It displays the interrelation betwee two variables and often used to find interactions between those variables.
True Positive, True Negative, False Positive, False Negative
If you are making a prediction about a binary case, four types of results can be expected:
| Prediction | Actual Value | |
|---|---|---|
| 0 | 0 | » True Negative (TN) |
| 0 | 1 | » False Negative (FN) |
| 1 | 0 | » False Positive (FP) |
| 1 | 1 | » True Positive (TP) |
To facilitate understanding or memorizing the concepts above, the naming of TN, FN, FP, TP is based on the prediction.
- If the prediction is right, it is True
- If the prediction is 0, it is Negative
- And if the prediction is 0 and right, it is True Negative
Terminology and Measurements from Confusion Matrix
Recall=Sensitivity=Hit Rate=True Positive Rate(TPR)
Summarizes how well the model predicts or classifies the positive(1) data. The value is calculated by dividing the whole actual positive data by correctly predicted positive data. (True Positive)
Specificity=Selectivity=True Negative Rate(TNR)
Specificity is similar to Recall or Sensitivity, but retrieving the rate of correctly predicted negative data (True Negative) to the whole actual negative data.
Fallout=False Positive Rate(FPR)
This concept refers to falsely predicted rate of predicting actual positive data negatively.
Miss Rate=False Negative Rate(FNR)
This concept refers to falsely predicted rate of predicting actual negative data positively.
Precision=Positive Predictive Value(PPV)
Precision is about being precise with the prediction. It tells how likely the predictive positive will be correct.
Accuracy(ACC)
Percentage of getting the predictions right. This summarizes how well (accurate) the model predicts or classifies.
Performance Metrics
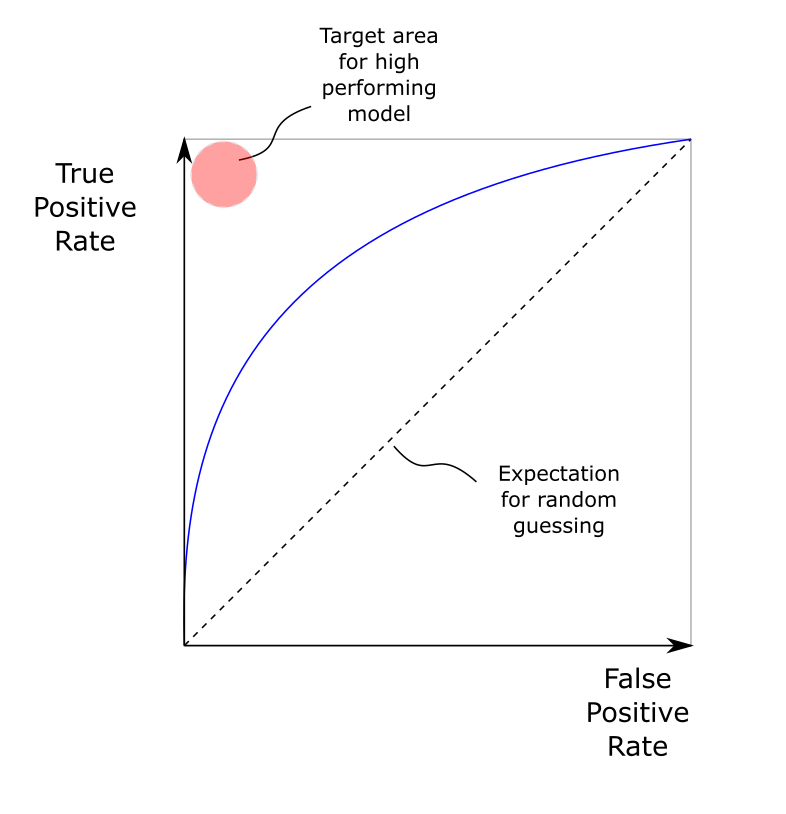
R.O.C Curve (Receiver Operating Characteristics)
-
The ROC curve has Specificity(False Positive Rate) and Sensitivity(True Positive Rate) as the two axis.
-
The higher the curve is above y=x graph, the better the performance of a model is.
-
However, ROC is an illustrated graph of FP and TP. And it is difficult for comparing models in some cases where the difference is not intuitively noticable. Thus, AUC (Area under Curve) is used as a parameter.
-
The ROC AUC value is area of the ROC curve. The highest value is 1, and the better the model, the higher the AUC value is.
Precision Recall Plot (PR Graph)

- Precision-Recall plot, as its name presents, uses precision and recall to evaluate model.
- Generally, it uses recall as horizontal axis and precision on the vertical axis in 2-Dimensional plotting.
- The PR Graph is used when the distribution of labels used in classification is highly unbalanced; when the number of positive cases overwhelms the number of negative cases.
- Just like the ROC curve, it uses AUC as a parameter to evaluate the model.
F1-Score (F score when $\beta$=1 )
\[F_{\beta} = \frac{(1+\beta^2)(Precision * Recall)}{(\beta^2*Precision*Recall)}\]- In order to measure performance of a model with AUC of ROC or PR, many calculations are required in various throughputs.
- F1 Score is used to express the performance of a model in a single number.
- When $\beta$ = 1, the F score is called F1 Score and it is a widely used metric for model evaluation.
Python Code Example
from sklearn.metrics import classification_report as clr
from sklearn.metrics import confusion_matrix as cm

# Confusion Matrix (TP,FP,TN,FN)
print(cm(test_y     # List of Actual Values
        , pred_y))  # List of Predicted Values


# Classification Report (Precision, Recall, F1-Score)
print(clr(test_y    # List of Actual Values
        , pred_y))  # List of Predicted Values