Cocktail Recipe Analysis (part.3)
In the previous post, we processed our data to standardize different liquid measurements into oz. Before processing our data, we must think of how to use of our data. We talked about the two ways of helping people to make decisions in the first post:
-
Recommendation System
-
Ingredient Network Analysis
Let’s try Recommendation System.
Ideas for Cocktail Recommendation System
There are several types of recommendation system depending on how it suggests or defines “relevant” items to people. Two major categories exists to define the “relevancy”: Collaborative Filtering Method and Content Based Method. The diagram below is to facilitate illustration of the two methods.

source: : https://www.themarketingtechnologist.co/building-a-recommendation-engine-for-geeksetting-up-the-prerequisites-13/
Collaborative Filtering Method and Content-based Filtering Method both require interaction data between users and items (Utility Matrix). In our case, it would be the rating data of cocktail by drinkers, which we do not have at this moment. Thus, we are just going to try Content-based Filtering Approach only using the recipe information of the cocktails.
The most accepted way of representing similarity is computing distance between two entities. Let’s ponder on how friends represent one’s characteristics in this quote “Your friends are a reflection of your own personality”. We can say that “close” friends share similar characteristics. Family members who are usually closer than your friends even look similar. Taking this analogy into account, we can define similarity as the distance between entities. (Smaller the distance, closer the two elements are and the more similar they are)
TL;DR: Build recommendation system with Content-based Filtering using the similarity between cocktail recipes measured by distance.
Examples of Computing Similarity
Now the complication of the recommendation system lies on how to compute distance between cocktail recipes.
There are many ways to measure distance and similarity depending on the context. The following are only a few well known methods:
- Euclidean distance measures the length of a straight line between two points in the plane.
- Jaccard distance measures how dissimilar two sets are by taking the proportion of total number of non-common elements to the union of two sets.
- Word Mover’s distance use word embedding to calculate distance between documents even considering relevant ones without sharing common words. The magic comes from calculating minimum traveling distance between documents by comparing words. This assumes that synonyms will have shorter distance after the embedding.
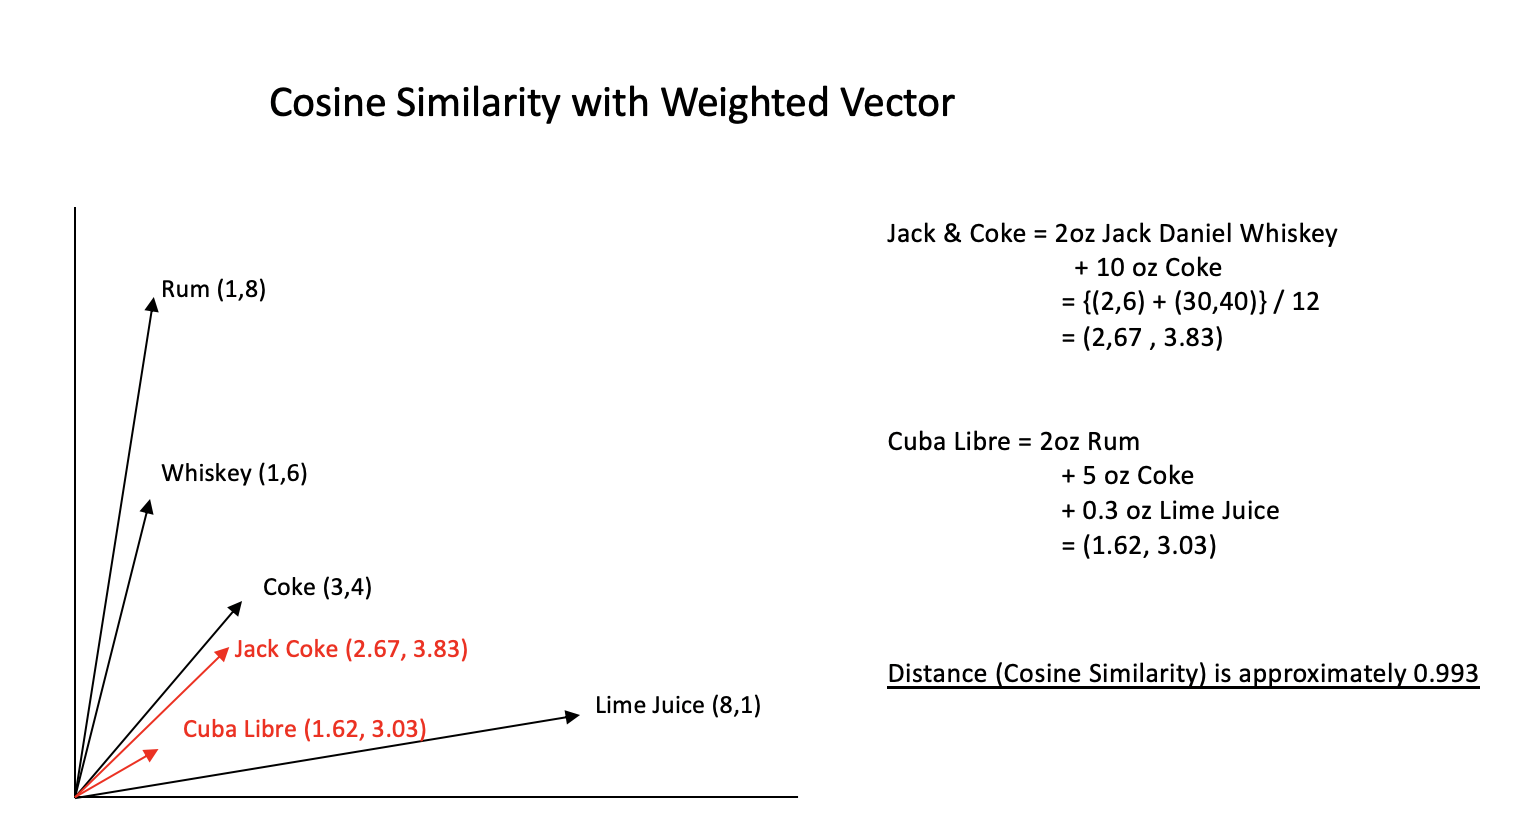
- Cosine similarity measures the similarity of vectors by computing their inner products. The smaller angle the two vectors share, higher the similarity.
Among the many methods of measuring similarity which one should we adopt? Should we say that recipes are similar when they share common ingredients? Or should we convert text into numbers with embedding methods and then calculate the distance?
Defining “Similar Cocktails”
When you call something similar, the notion is based on resemblance of specific features. When we say two cocktails are “similar”, it refers to the taste, color or ingredients that they share. As our data includes neither taste nor color, we need to make the most out of ingredients. Because flavor depends on the ingredients, we can hope our model to capture the information. For example, Jack and Coke consists of whiskey (Jack Daniel mostly) and coke. Cuba Libre is a mixture of rum and coke. Because the two shares a common ingredient coke, we can expect the two cocktails to be similar in taste. However, the important idea is that the ratio of ingredient should be similar. Depending on the total amount of cocktail, 0.5oz of coke may or may not influence the overall taste.
Embedding cocktail ingredients with Fasttext
import pandas as pd
import fasttext
from sklearn.metrics.pairwise import cosine_similarity as cos_sim

# Load recipe instruction data
with open("./pickle_data/cocktail_recipe_instruction.pickle", "rb") as h:
    cocktail_instructions = pickle.load(h)

# Preprocessing for fasttext embedding
## We want"Jack Daniel" to be recognized as a single noun,
## so converting it to "Jack_Daniel"
def phrase_to_word(phrase):
    """
    Replace spaces in a phrase to underscores to treat it as one word
    """
    if type(phrase) == str:
        return "_".join(phrase.split())

    elif type(phrase) == list:
        return ["_".join(element.split()) for element in phrase]

# Create a recipe corpus to train the pretrained fasttext model
corpus = []

for key,value in cocktail_instructions.items():
    drink_name = phrase_to_word(key)
    drink_name = drink_name.replace(" recipe","")
    ingred_names = phrase_to_word(list(cocktail_recipes[key].keys()))
    ingred_names = ", ".join(ingred_names)

    sentence = "{} is made with {}".format(drink_name, ingred_names)

    corpus.append(value + " " + sentence)

corpus = " ".join(corpus)

# save training corpus to txt file
with open("./corpus.txt","w") as f:
    f.write(corpus)

# training fasttext model
model = fasttext.train_unsupervised("./corpus.txt")

# Ingredient vectors
ingredients_vec = [model.get_word_vector(x) for x in nnf.index]
We have successfully trained our fasttext model and embedded ingredients into vector space.
Converting from string to numeric
Our recipe dataframe is stored as string values. We need to convert them into numeric values to vectorize cocktails:
# Read preprocessed data
df = pd.read_csv("recipe_cleaned_v1.csv", index_col=0, dtype=str)
df = df.fillna("0")

nf = df.copy()

for c in df.columns:
    numeric = []
    for ingredient in df[c]:
        numeric.append(ingredient.replace(" oz",""))
    nf[c] = numeric

for c in nf.columns:
    nf[c] = pd.to_numeric(nf[c], errors="coerce")

nf = nf.fillna(0)

# column sum should not be 0
# remove cocktail recipes without any units
nf = nf.loc[:,(nf.sum(axis=0) != 0)]
nnf = nf/nf.sum()
nnf.to_csv("./recipe_in_numbers_oz.csv")
Vectorizing Cocktails & Computing Similarity
Now the preprocessing is over. We have our fasttext embedding model and recipe dataframe. Let’s create cocktail vectors!
# calculated cocktail vectors from recipe
embedded_drinks = [np.dot(nnf[c],ingredients_vec) for c in nnf.columns]

# calculating similarity between cocktails
sim_matrix = pd.DataFrame(cos_sim(embedded_drinks), columns=phrase_to_word(list(nf.columns)),
                            index=phrase_to_word(list(nf.columns)))

# function for getting the 30 best similar cocktails from the input
def sim_drinks_30(drink):
    """
    Returns the top 30 cosine similarity score of input drink name and other drinks.
    """
    return sim_matrix.sort_values(by=[drink],ascending=False)[drink][:30]
Similarity Result
sim_drinks_30("Jack_and_Coke")
Jillian’s_Yankee 0.999889 Jack’s_Vanilla_Coke 0.999803 Jake_Cocktail 0.999024 Fuck_You_#2 0.997343 Carmel_Coke 0.995880 Cokaretto 0.995880 Jim_Rogers 0.995128 Bloody_Jack 0.995015 Evil_Jake 0.994219 Golden_Coke 0.993891 Hammer_&_Nail 0.993663 Old_Rootbeer_Float 0.992896 Laze_on_the_Deck 0.992487 Licorice_Vyos 0.992119 Assassin 0.991627 Dark_Indulgence 0.991202 Doc_Harris 0.991098 Pirate’s_Treasure 0.990712 Jim_Beam_and_Coke 0.990603 Bacardi_Vanilla_Coke 0.990021 Bloody_Jim 0.989592 Beam_Me_Up 0.989308 Mist_and_Cola 0.989273 Jack_and_Cherries 0.987447 Candy_Cane_Cola 0.987273 Orange_Warthog 0.987147 Hennessy_and_Coke 0.987083 Black_Cherry_Coke 0.986790 Mexican_Riptide 0.986513 Kirsch_Cuba_Libre 0.985931 Name: Jack_and_Coke, dtype: float64
It seems that the recommendation system is pretty successful at retrieving drinks with similar ingredients! However, this system is not very effective. People would want drinks that have similar taste or vibe. Variations of a drink won’t be always satisfying. This is why we need utility matrix and user-item rating information to create a better recommendation system.
Visualizing Cocktail Vectors with T-SNE
Now that the cocktails are converted into vectors, let’s visualize them. We might be able to observe patterns or clusters. Visualizing 100 Dimension itself is impossible. This is where dimension reduction techniques chime in. In this code, T-SNE is adopted:
from sklearn.manifold import TSNE
import seaborn as sns
import matplotlib.pyplot as plt

cocktail_df = pd.DataFrame(embedded_drinks)

# TSNE dimension reduction
tsne = TSNE(metric="euclidean", perplexity=35)
coord = tsne.fit_transform(cocktail_df)
tsne_vec = pd.DataFrame(coord, columns=["X","Y"])
tsne_vec["cocktail"] = nnf.columns

# Plot with Seaborn
plt.figure(figsize=(30,30))
ax = sns.scatterplot(x=tsne_vec["X"],
                y=tsne_vec["Y"])

# Annotate each cocktail points
for line in range(0,tsne_vec.shape[0]):
     ax.text(tsne_vec.X[line],
             tsne_vec.Y[line],
             tsne_vec.cocktail[line],
             horizontalalignment='center',
             size=5, color='black',
             weight='semibold')

Apparently, there are numerous distinctive clusters formed from 11551 cocktails.
Final Remarks
The cocktail project ends here. It took me about 6 months to finally wrap up this project. The net time I spent on this? Probably less than a week :(
While doing this project I learned several important lessons:
-
When collecting data, always separate them into the smallest granular level
Because merging is easier than parsing in general. I should have collected the ingredient data with units as a separate feature when scraping it from the source.
-
The hardest part of NLP is preprocessing
Coding the vectorization, fasttext training, model implementation only took about 10% of the total time spent on this project. The rest was spent on preprocessing.
-
When you create model, think of the evaluation metric or how you are going to assess the performance
Well, I made a small recommendation system, but I do not know how to assess it. Should I ask my peers about the opinion? Is there an answer-like-cocktail-recommendation-data out there somewhere?
Next time I do a project, I will remind myself of these lessons that I learned.